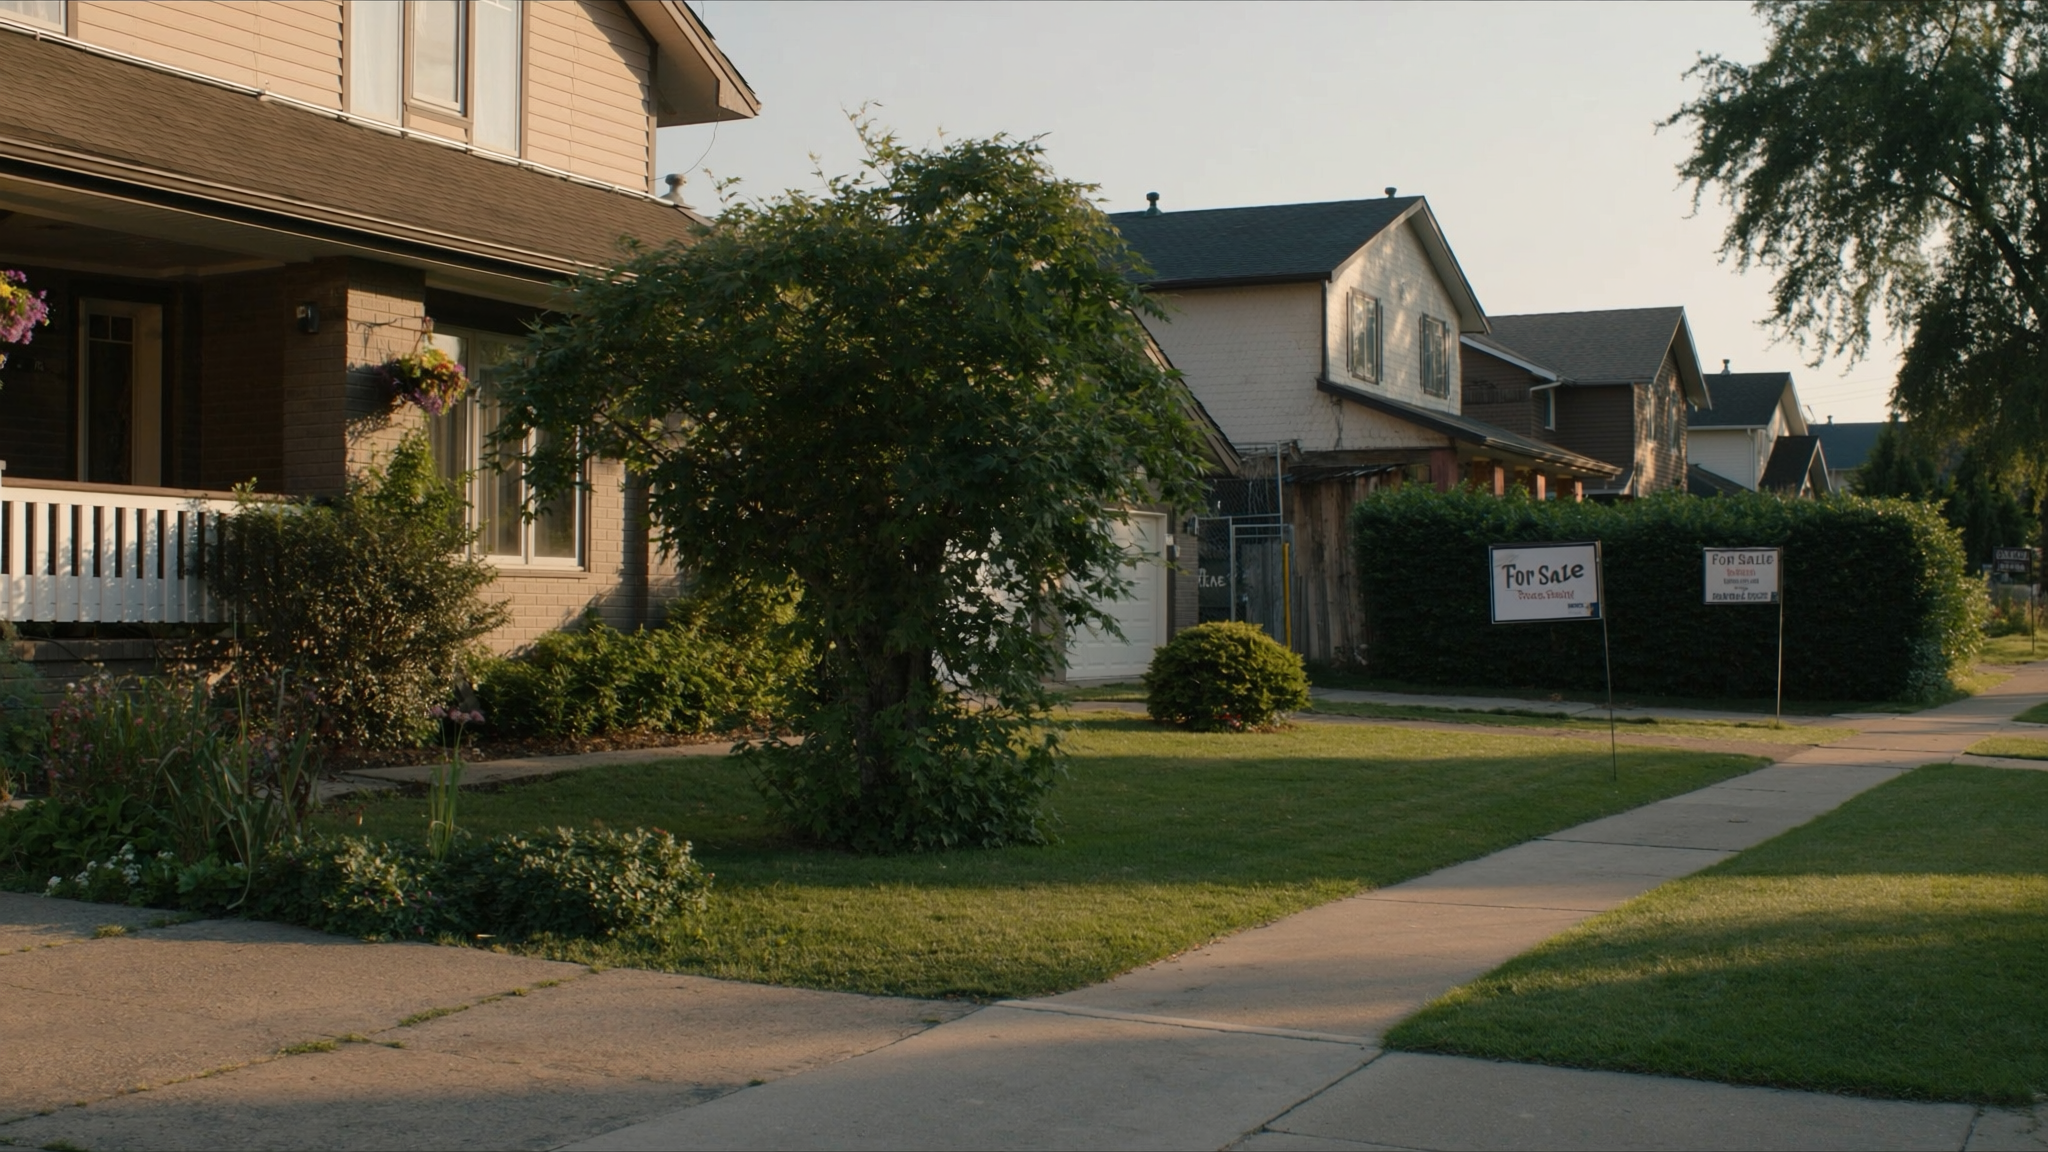
August New-Home Prices Slip 0.1% Nationally — Toronto Edges Up, Still Down 4.3% Year Over Year
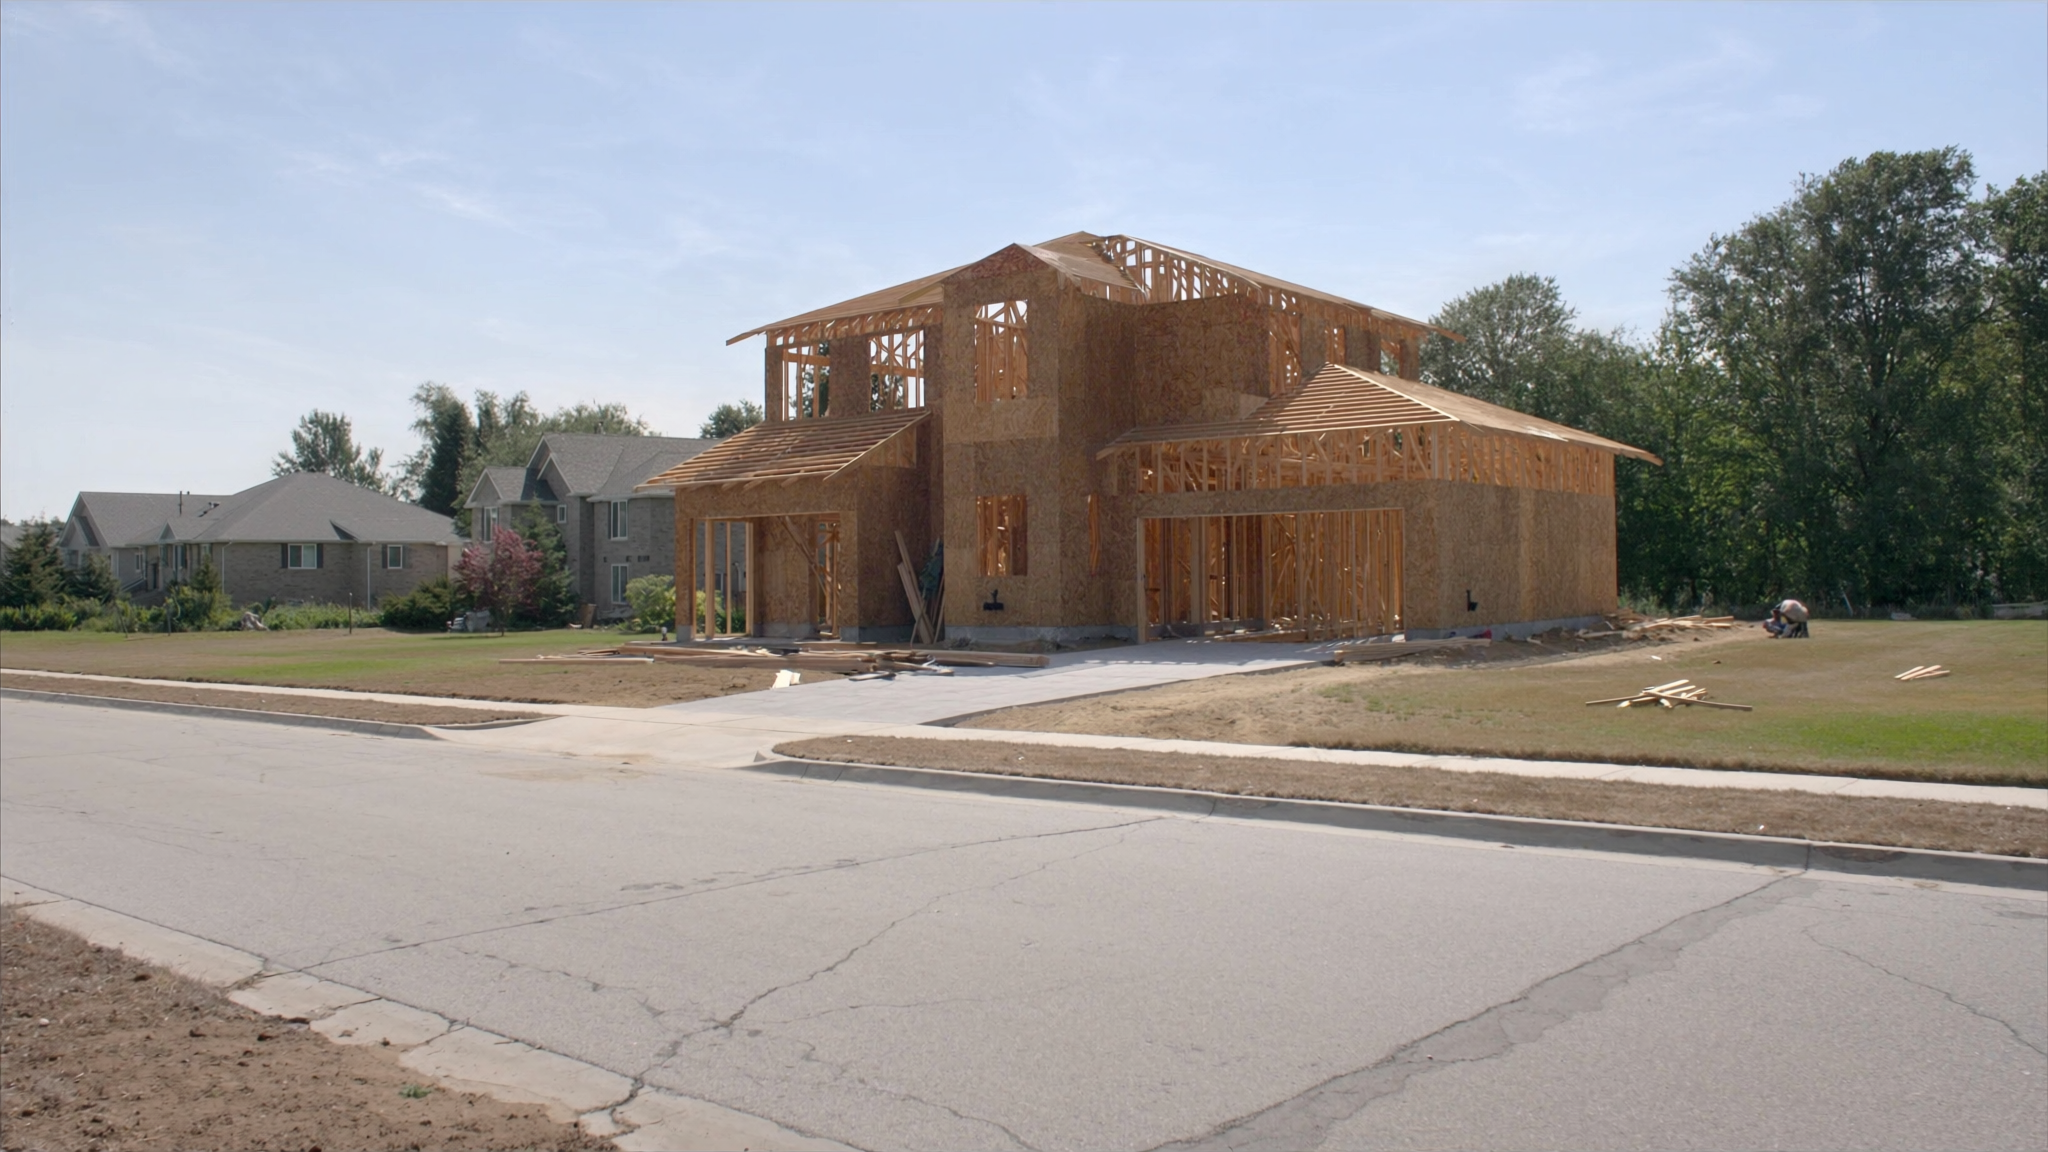
Statistics Canada's August NHPI fell 0.1% month over month nationally and in Ontario (−3.4% y/y). Toronto's total index rose 0.2% m/m to 106.0 but remains 4.3% below August 2025 — with Oshawa still the softest large Ontario CMA at −5.6% y/y.
Statistics Canada released the August 2026 New Housing Price Index on September 17, and the national contractor selling-price gauge slipped again: the total house-and-land index fell 0.1% month over month to 120.4 (December 2016 = 100) and is down 2.0% year over year. Ontario matched the national monthly dip at −0.1%, but the provincial year-over-year cut is deeper at −3.4%.
For GTA buyers and builders, Toronto is the twist inside that soft national print: the CMA's total index edged up 0.2% month over month to 106.0, even as it remains 4.3% below August 2025. New-home contract prices in Toronto are still far below their late-cycle peak on a year-over-year basis — they just stopped falling for a month.
National: another soft month, house prices leading the annual decline
The New Housing Price Index measures selling prices agreed between builders and buyers for new single homes, semis and townhomes at the time the contract is signed, excluding GST/HST. It is not seasonally adjusted and is not revised.
In August, Canada's total (house and land) index moved from 120.5 in July to 120.4 (−0.1%). Versus August 2025's 122.9, that is a 2.0% year-over-year decline. The house-only component fell 0.1% month over month to 121.6 and is down 2.6% year over year — a steeper annual slide than land, which was flat month over month at 116.4 and down 0.9% year over year (StatCan marks land as estimated).
Among large provinces, Ontario, Alberta and British Columbia each posted a −0.1% monthly change on the Daily release cards. Manitoba rose 0.2%. Quebec, Saskatchewan and several Atlantic provinces were unchanged month over month. Nova Scotia fell 0.2%.
Ontario: −3.4% year over year as several CMAs keep sliding
Ontario's total index landed at 117.5 in August, down 0.1% from July's 117.6 and 3.4% below August 2025's 121.6. House-only prices in the province were flat month over month at 118.0 but are down 4.1% year over year — a clear signal that builder contract pricing for the structure itself remains under pressure even when land is sticky.
Outside Toronto, several Ontario CMAs still look soft:
- Oshawa total index 112.2: −0.6% month over month and −5.6% year over year — the steepest annual decline among the Ontario CMAs checked for this piece.
- Hamilton 107.7: −0.2% m/m, −3.5% y/y.
- Kitchener–Cambridge–Waterloo 150.4: −0.4% m/m, −3.0% y/y.
- Ottawa–Gatineau (Ontario part) 161.1: −0.2% m/m, −0.4% y/y — almost flat annually.
- London and Windsor were unchanged month over month, with year-over-year declines of 1.7% and 0.3% respectively.
Toronto: a 0.2% monthly bounce inside a −4.3% annual gap
Toronto's total house-and-land index rose from 105.8 in July to 106.0 in August (+0.2%). House-only moved the same way, from 102.0 to 102.2 (+0.2%). Versus August 2025, though, Toronto is still down 4.3% on the total index and 5.7% on house-only — a wider annual discount than the national −2.0% / −2.6% pair.
That combination — a tiny monthly lift on a still-deep year-over-year cut — fits a market where builders are no longer marking contracts down every month, but new-home asking levels remain well below last summer's. It also sits beside yesterday's CMHC August starts print, which showed Toronto actual starts in centres of 10,000+ down sharply year over year even as national SAAR held flat.
What this means for GTA buyers, sellers and agents
NHPI is not the MLS resale price. It is the contractor contract price for a comparable new house, so it speaks more to new-build negotiations, freehold and townhome absorption, and how builders are pricing the next pad than to condo resale comps. For buyers shopping new freehold or town product in the GTA, August's Toronto print says: year-over-year pricing power is still with the buyer (−4.3% total, −5.7% house-only), but the monthly slide paused. Locking a new-home contract today is not the same as catching last winter's trough if builders have stopped shaving.
Sellers of competing resale freeholds and towns should treat NHPI as a soft ceiling check: when new-build contracts are still ~4–6% cheaper than a year ago in Toronto, resale asking that ignores that gap will meet resistance. Agents framing fall negotiations can use the primary pair cleanly — national and Ontario soft on the month, Toronto slightly up month over month but still deep in the red year over year — without inventing a turn that the annual numbers do not support.
Next NHPI release: September 2026 data on October 22, 2026.
Sources
- Statistics Canada — The Daily: New Housing Price Index, August 2026 (released September 17, 2026)
- Statistics Canada — Table 18-10-0205-01: New housing price index, monthly
- Statistics Canada — New Housing Price Index, August 2026 (PDF)
Compiled by the Real Estate HQ editorial desk from primary data releases (sources linked above) and reviewed for accuracy. Month-over-month and year-over-year percentage changes are calculated from index levels in Table 18-10-0205-01 and match the Daily release cards for Canada and Ontario. Figures are as reported on the release date.

Written by
Frank Lee
Market news and data explainers
Market news and data explainers. Writes from public releases (TRREB, CMHC, StatCan, BoC) with original analysis for Ontario / GTA readers.
View all articles by Frank →