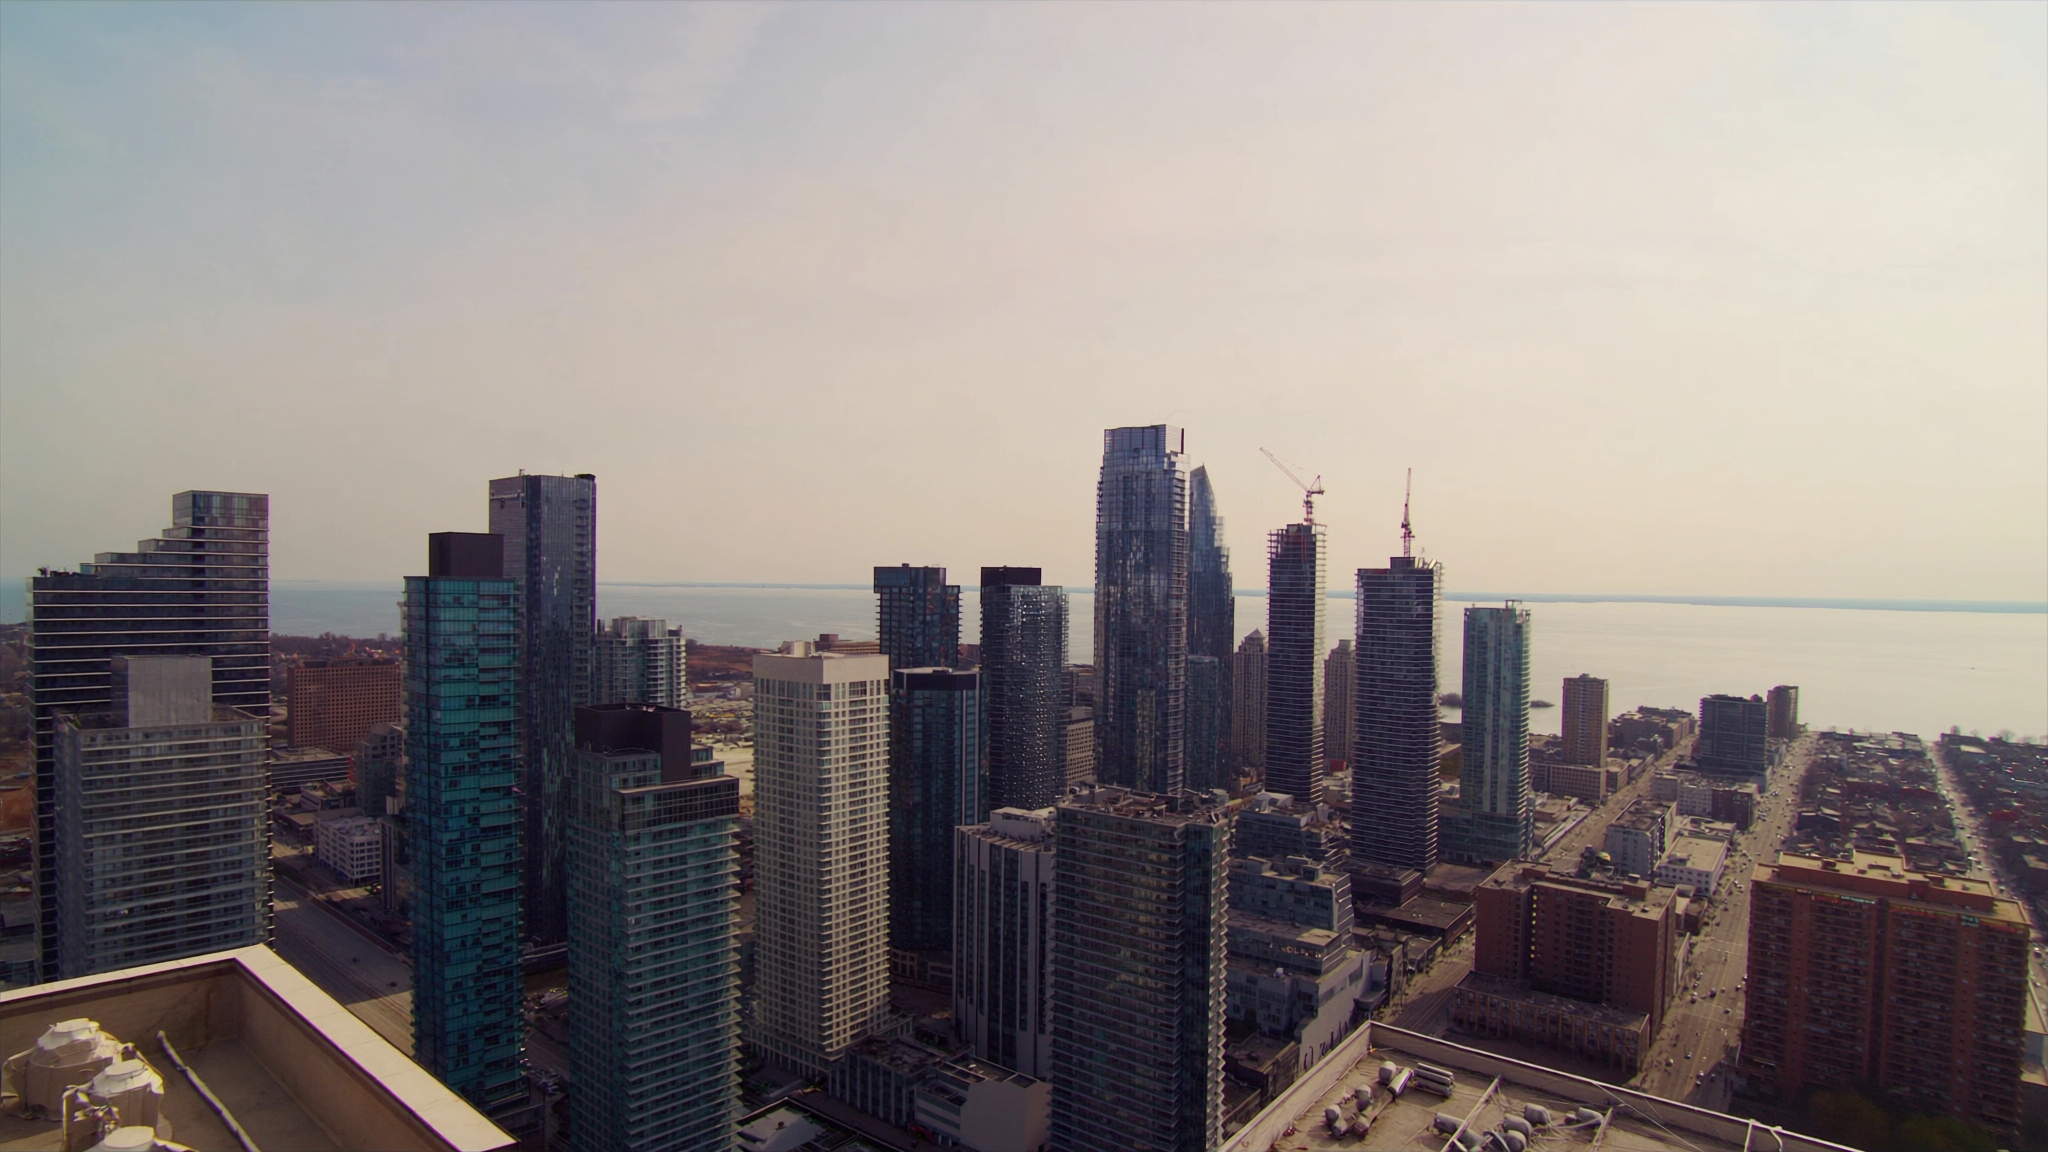
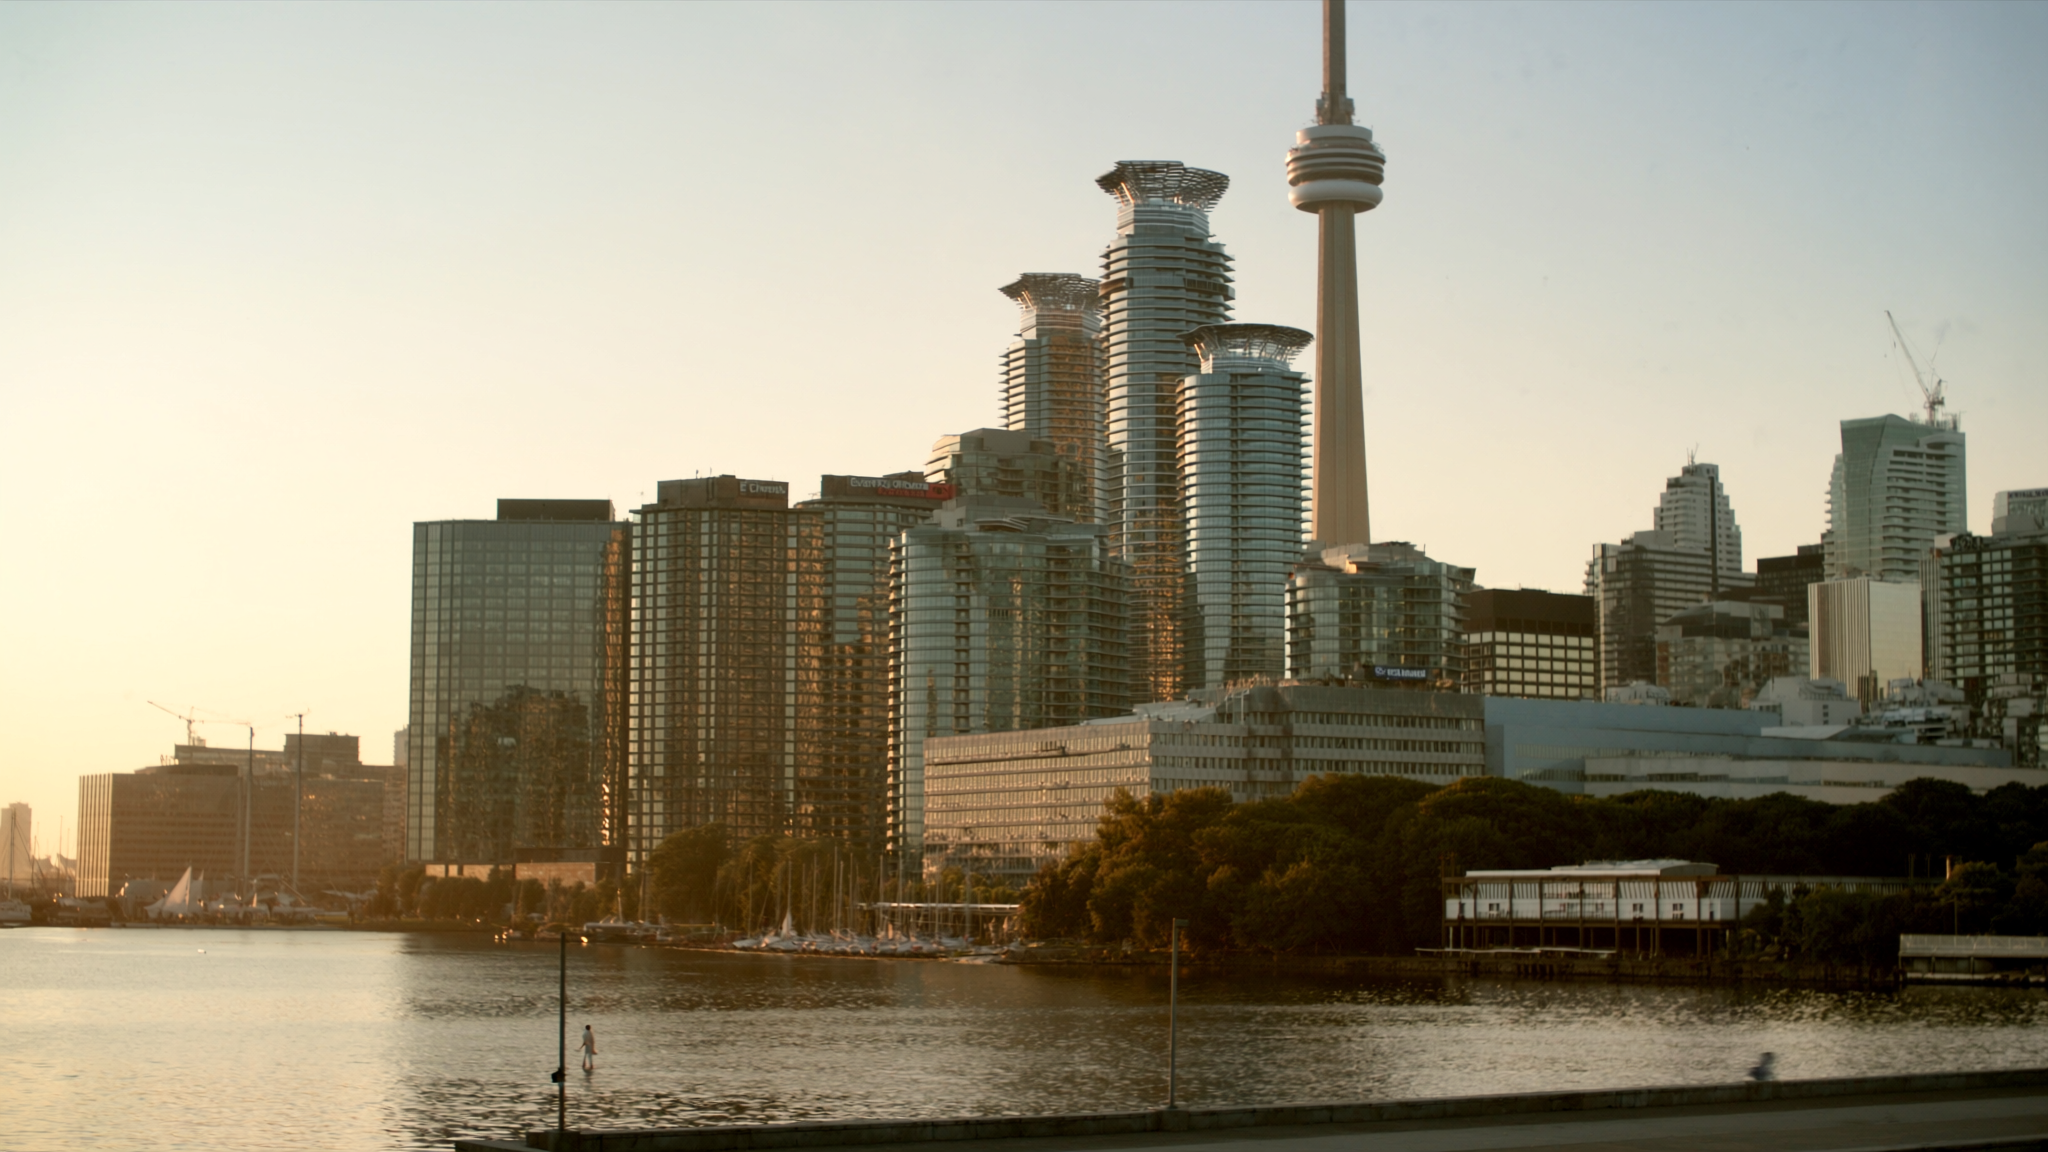
Toronto Two-Bedroom Asking Rent Hit $2,650 in Q2 — $490 Above What Tenants Actually Pay
Statistics Canada's Q2 2026 Quarterly Rent Statistics (released Sep 9) put the all-CMA two-bedroom asking average at $2,130 (−3.6% YoY). Toronto was second-highest at $2,650 asking versus $2,160 paid — a $490 gap that defines the GTA turnover market.
Statistics Canada's Quarterly Rent Statistics for the second quarter of 2026, released September 9, put a hard number on the gap Ontario renters already feel: what a landlord advertises and what an existing tenant pays are not the same market.
Across all census metropolitan areas combined, the average asking rent for a two-bedroom apartment was $2,130 per month in Q2 2026 — down 3.6% from Q2 2025. Toronto was the second-most expensive CMA on the asking-rent list at $2,650, behind only Vancouver ($3,030). The Toronto paid-rent average for the same unit type was $2,160 — $490 a month below the asking print.
That spread is the story for GTA renters, landlords and condo investors. Asking rent is the price posted on major listing platforms. Paid rent is what sitting tenants are actually writing cheques for, often under older leases and Ontario's rent-increase guideline. StatCan is explicit that both concepts matter, and that the QRS series is experimental and subject to revision.
The national and Toronto numbers
- All CMAs, asking rent (2-bedroom): $2,130 (−3.6% YoY)
- Toronto asking rent (2-bedroom): $2,650 (second-highest CMA; YoY % not published in The Daily)
- Toronto paid rent (2-bedroom): $2,160 (second-highest paid-rent CMA after Vancouver's $2,470)
- Toronto asking–paid gap: $490 per month
- Highest asking rents nationally: Vancouver $3,030, Toronto $2,650, Victoria $2,640, Halifax $2,400
StatCan did not publish a year-over-year percentage change for Toronto's asking rent in the Daily release. Nationally, asking rents fell in many CMAs — including Vancouver (−4.1%), Montréal (−5.2%) and Calgary (−6.4%) — while they rose in others such as Thunder Bay (+6.5%), Halifax (+5.3%) and Saskatoon (+5.2%). Treat any Toronto YoY claim that is not in the primary release as unverified.
Ontario CMAs on the asking-rent ladder
The chart behind The Daily (Table 46-10-0092-01) places several Ontario markets well above the all-CMA average:
- Toronto: $2,650 asking / $2,160 paid
- Ottawa–Gatineau (Ontario part): $2,360 asking (paid rent suppressed for Q2 2026)
- Guelph: $2,190 asking
- Hamilton: $2,150 asking
- Kitchener–Cambridge–Waterloo: $2,120 asking / $1,720 paid
- Barrie: $2,100 asking
- Oshawa: $2,000 asking
- Kingston: $1,940 asking / $1,750 paid
- Greater Sudbury: $1,940 asking / $1,400 paid
- London: $1,920 asking / $1,560 paid
- St. Catharines–Niagara: $1,900 asking
- Windsor: $1,850 asking
In almost every CMA where both measures were published, asking rent sat above paid rent. The national exceptions were Calgary, Regina and Edmonton — not Ontario. That pattern lines up with rent controls and long-tenure leases: existing tenants are shielded from the full asking-market reset when they stay put.
What this means for GTA renters, landlords and agents
For renters shopping now: Toronto's $2,650 asking average for a two-bedroom is the sticker price of turnover. Your negotiation room is still local — building age, inclusions, and how long a unit has sat — but the federal print confirms the GTA remains a high-asking market even while the national CMA average is falling year over year.
For sitting tenants: The $2,160 paid average is closer to your lived cost if you renewed under the guideline. The $490 gap is not free money for landlords on controlled units; it is the wedge between turnover pricing and sitting rents that investors underwrite every time a lease ends.
For landlords and condo investors: Softening national asking rents (−3.6% YoY) and a still-wide Toronto asking–paid gap cut two ways. New listings may need to meet the market; vacant units compete against a stock of lower paid rents. Do not mix this series with CMHC's October Rental Market Survey or the CPI rent index — StatCan spells out that those products measure different things.
For agents: When a buyer asks whether "rents are crashing," point them to the definitions. Asking rents across CMAs are down 3.6% year over year. Toronto remains the second-highest asking market in the country for a two-bedroom. Paid rents in Toronto are lower than asking, not higher — the opposite of Calgary and Regina in this release.
How to read the release (and what not to invent)
The Quarterly Rent Statistics program is run with CMHC. Asking rents come from major listing platforms and cover purpose-built and secondary-market units (not collective dwellings, vacation homes, mobile homes or subsidized housing). Paid rents are derived from the Labour Force Survey rent component and exclude social and affordable housing. Some asking-rent estimates use modelling adjustments for missing provider data in parts of 2025. QRS data are experimental.
Next Tier-A windows on the realestatehq.ca calendar: CREA national sales around mid-September, then CMHC August starts and StatCan building permits on September 16, with August CPI due around mid-month.
Sources
- Statistics Canada, The Daily — Quarterly rent statistics, second quarter of 2026, released September 9, 2026.
- Statistics Canada, Chart 1 — Average monthly asking rent and average monthly paid rent for a two-bedroom apartment, by census metropolitan area, second quarter of 2026 (Table 46-10-0092-01).
- Statistics Canada, Quarterly rent statistics, second quarter 2026 (PDF).

Written by
Frank Lee
Market news and data explainers
Market news and data explainers. Writes from public releases (TRREB, CMHC, StatCan, BoC) with original analysis for Ontario / GTA readers.
View all articles by Frank →